Analytics and leads are where Marketing Hub turns into a real business tool. Analytics show you how your listings are performing, and leads connect you directly with interested buyers. This guide walks through both sections so you can track results and respond to prospects quickly.
Open the Analytics Page
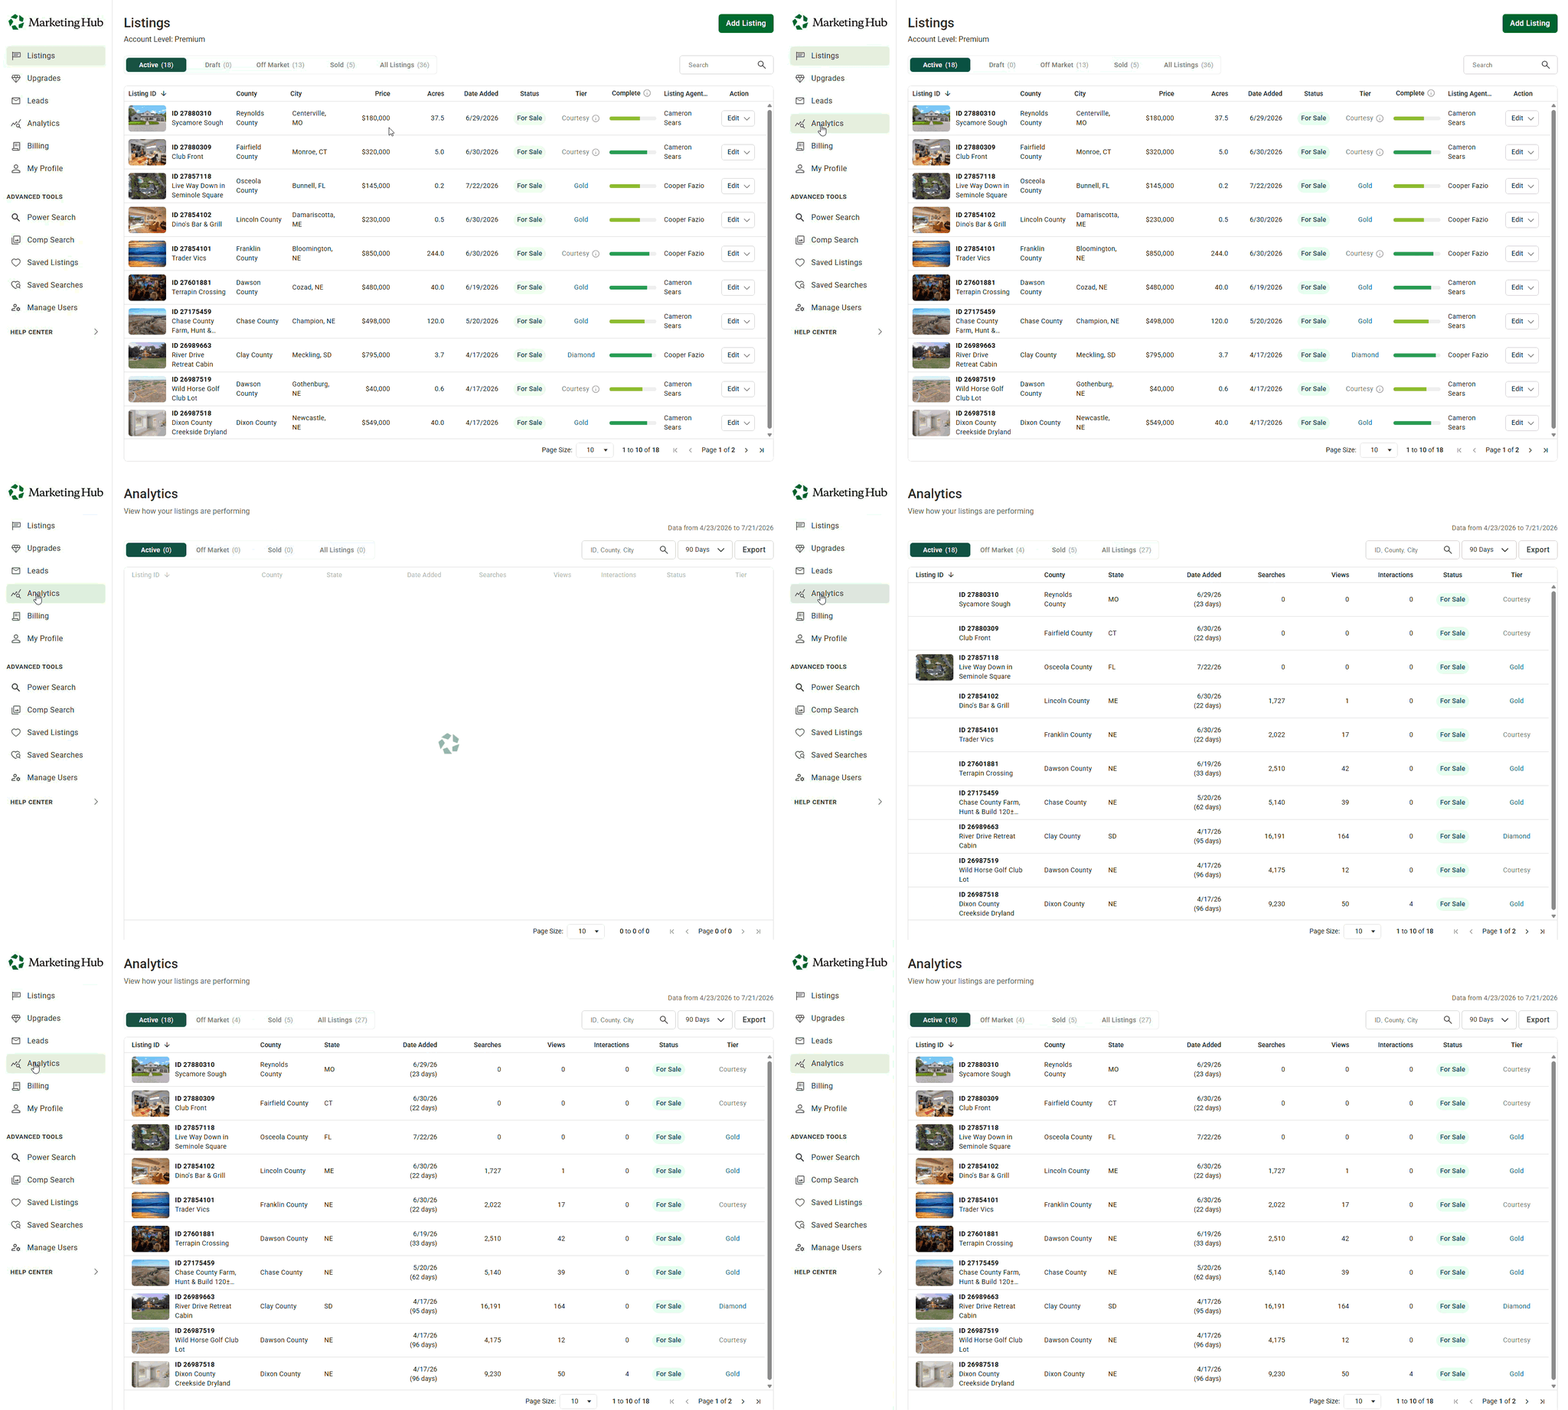
Find the Analytics page in the main navigation menu on the left side of your screen. This is your home base for tracking listing performance.
Sort, Search, and Export Listing Data
From the table you can slice the data to focus on what matters most:
- Status tabs: Filter by Active, Off Market, Sold, or All Listings. Each tab shows a live count of how many listings fall into that status.
- Search box: Jump straight to a specific listing by ID, county, or city.
- Time range: Adjust the window of data you want to review, choosing 7 days, 30 days, 90 days, 1 year, or a custom date range.
- Export: Download an Excel file of all your listing data for your own records or reporting.
Understand the Listings Table
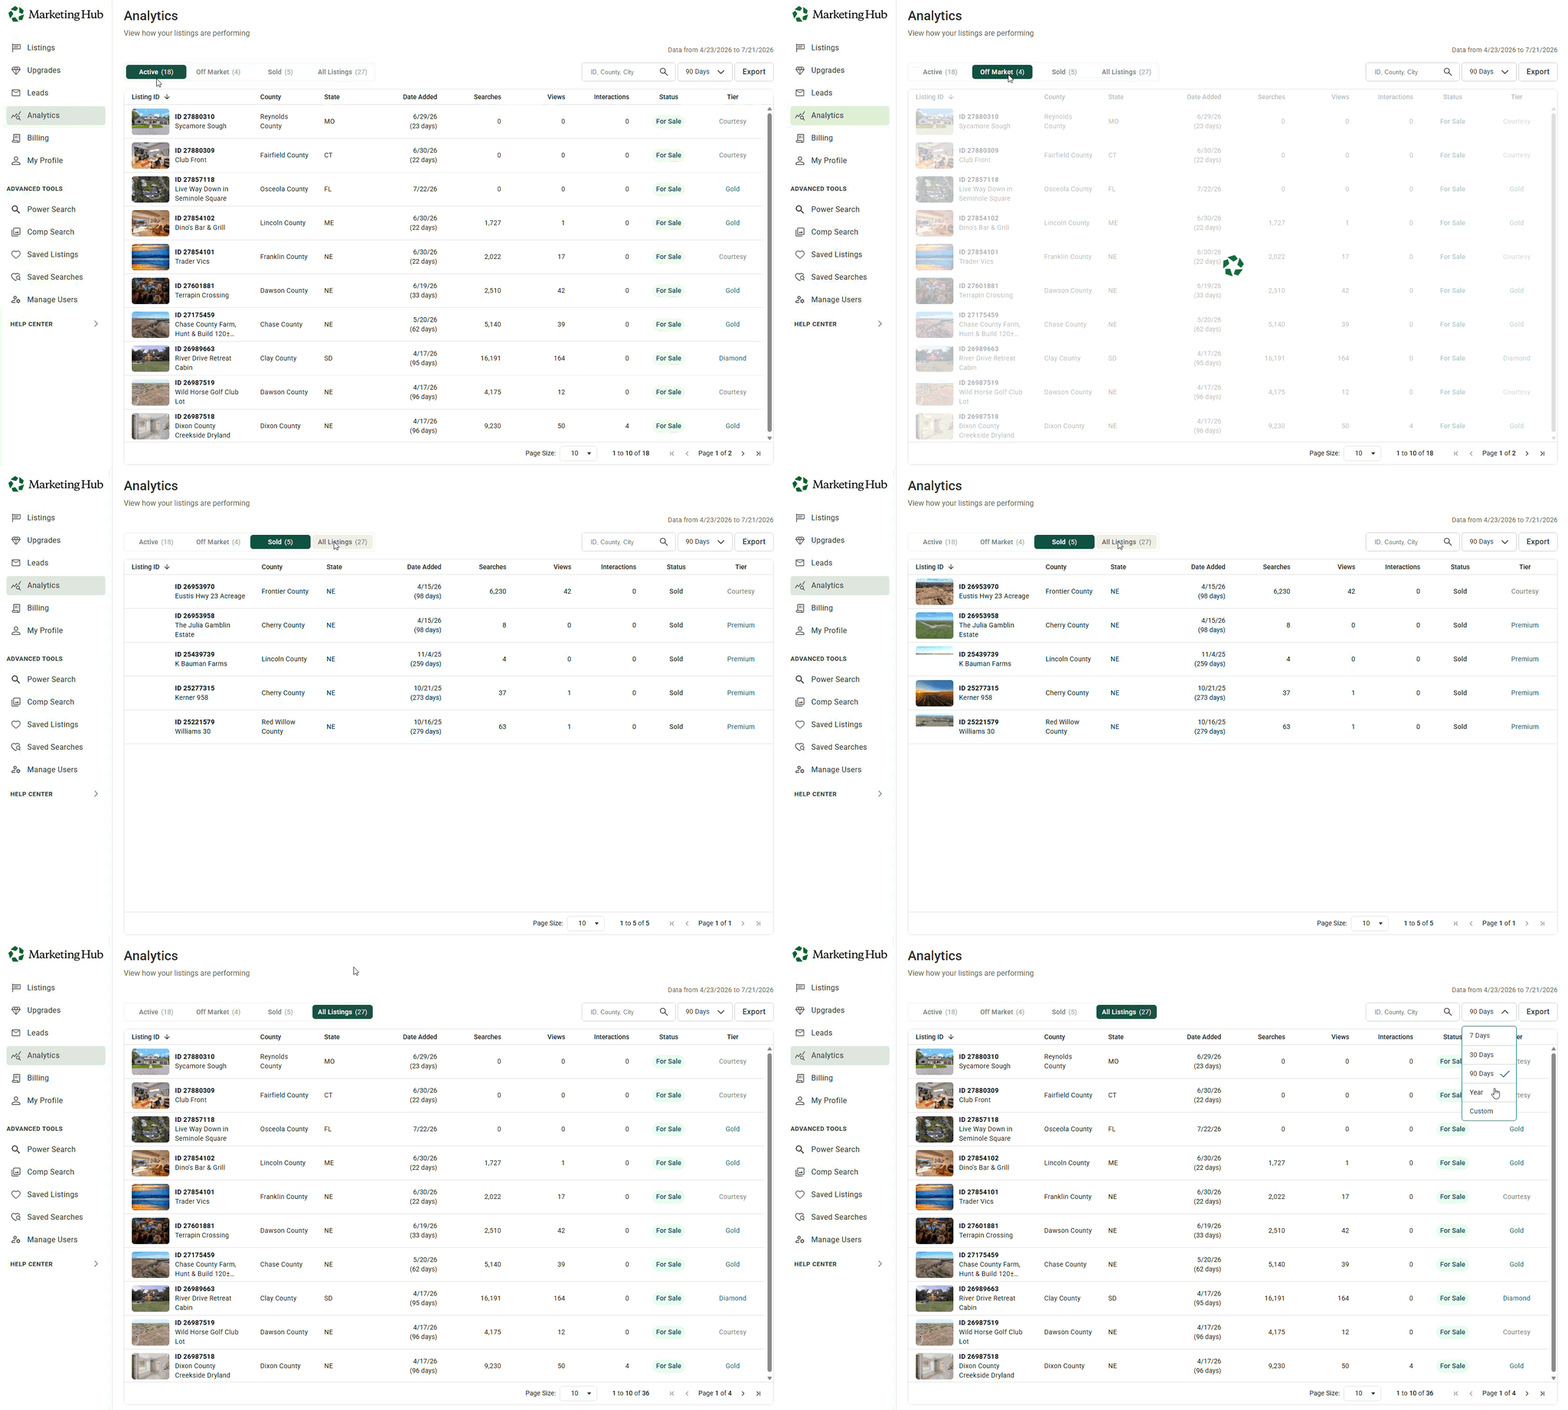
The table below the filters gives you a row-by-row view of every listing. For each one, you can see:
- Listing ID number, with the listing’s title displayed underneath it
- County and state
- Date added
- Number of times the listing appeared in searches
- Number of times the listing was viewed
- Number of buyer interactions, such as saves, shares, lead submissions, and brochure downloads
- Status, such as For Sale or Pending
- Tier, such as Courtesy, Private, Platinum, or Signature
Pro Tip: Sort by Any Column
Click any column title to sort the entire table. For example, click County to group all of your listings by county and spot regional trends at a glance.
Drill Into a Specific Listing
Click any listing in the table to open an in-depth view. Inside, you will find:
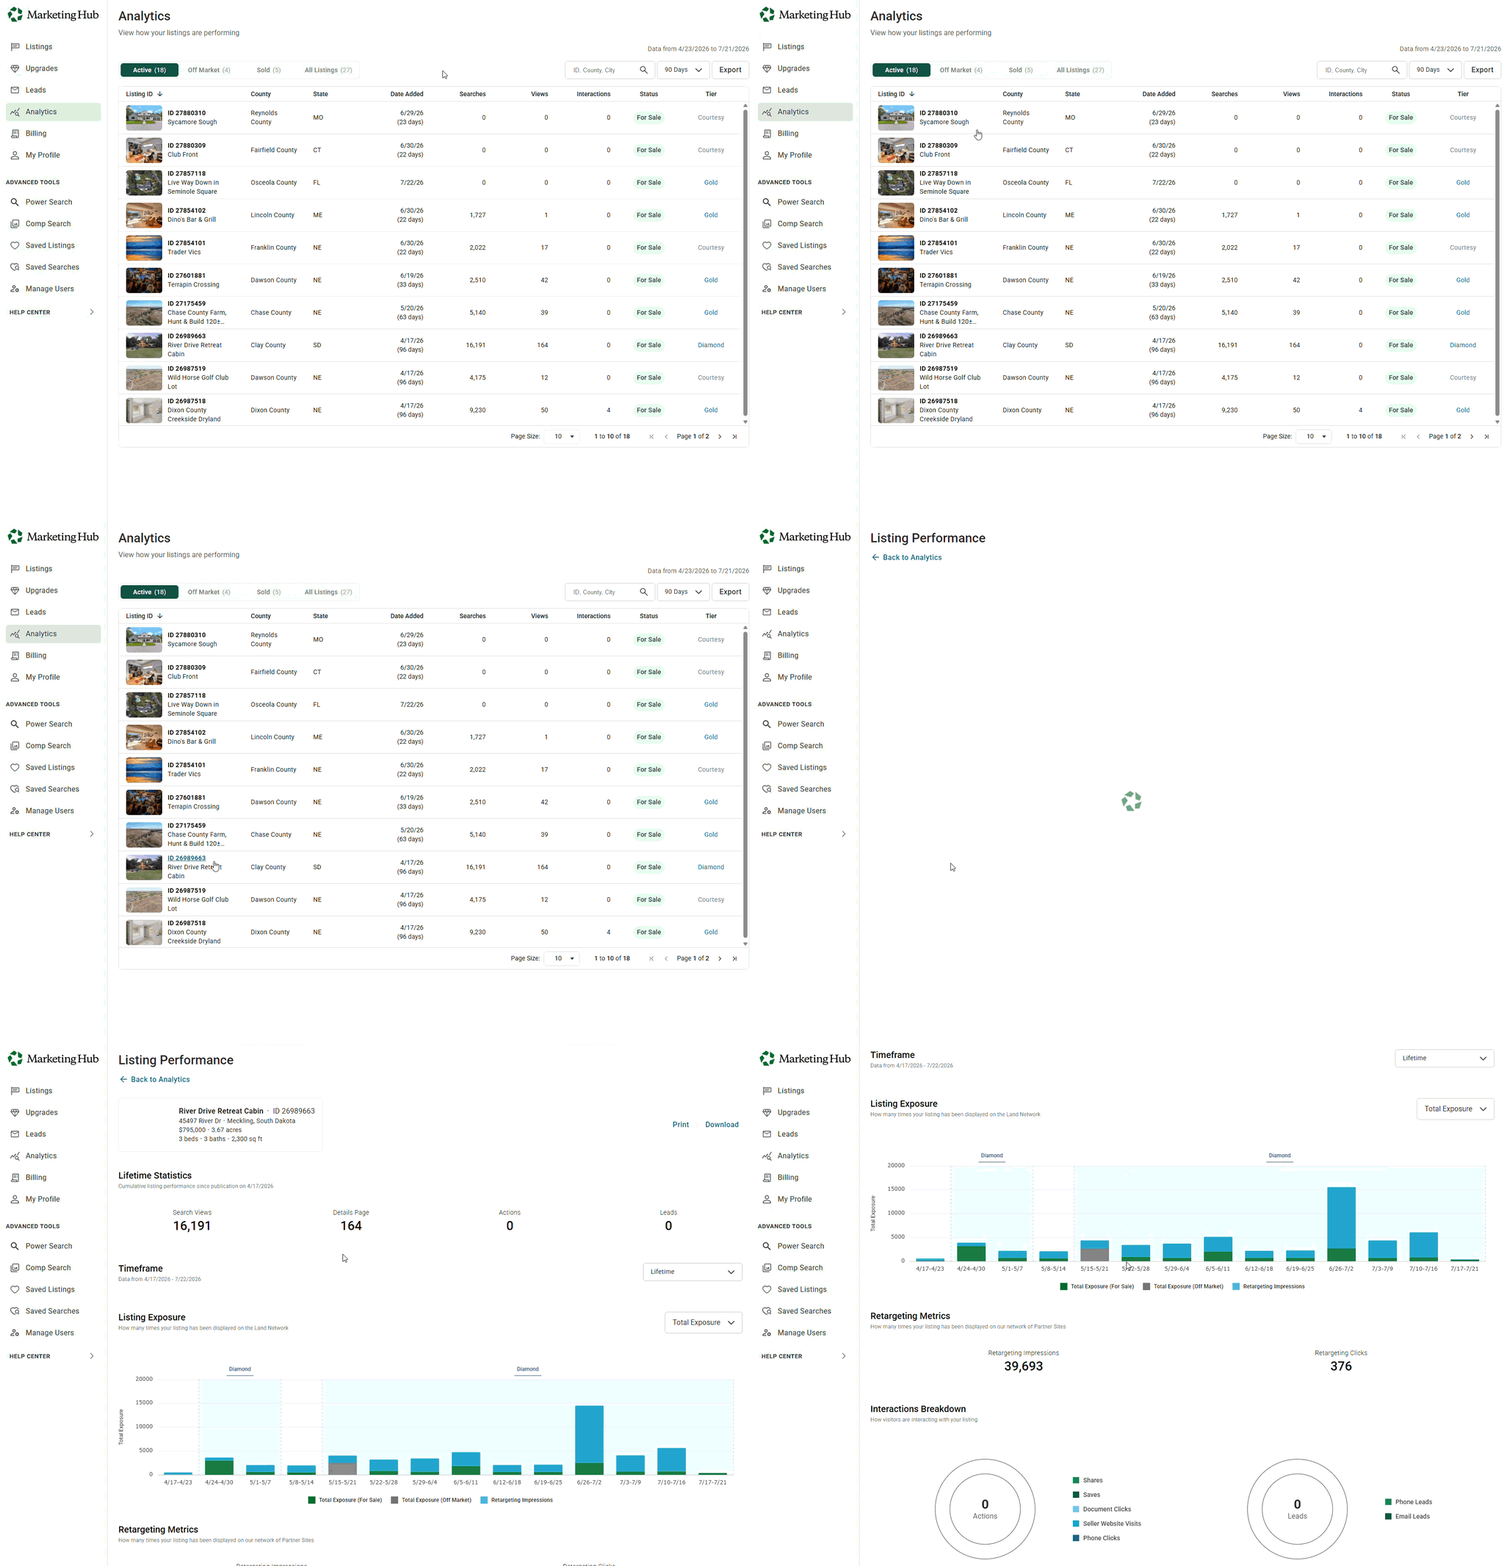
- Lifetime Statistics: search views, details page views, actions, and leads accumulated since the listing was published
- A Timeframe selector to adjust the data window, defaulting to Lifetime
- A Listing Exposure graph showing how many times the listing has been displayed on the Land Network over time
- An Interactions Breakdown with two charts: an Actions chart covering shares, saves, document clicks, seller website visits, and phone clicks, and a Leads chart covering phone leads and email leads
Open the Leads Section
When you are ready to see the buyers your listings are generating, navigate to the Leads section using the left-hand menu. Here you will find every message a potential buyer has sent you.
As with the Analytics page, you can slice the data using:
- Status tabs: Filter by Active, Archived, or Spam, each showing a live count of leads in that status.
- Search box: Jump straight to a specific lead.
- Time range: Adjust the window of data you want to review, choosing 7 days, 30 days, 90 days, 1 year, or a custom date range.
- Export: Download an Excel file of your lead data.

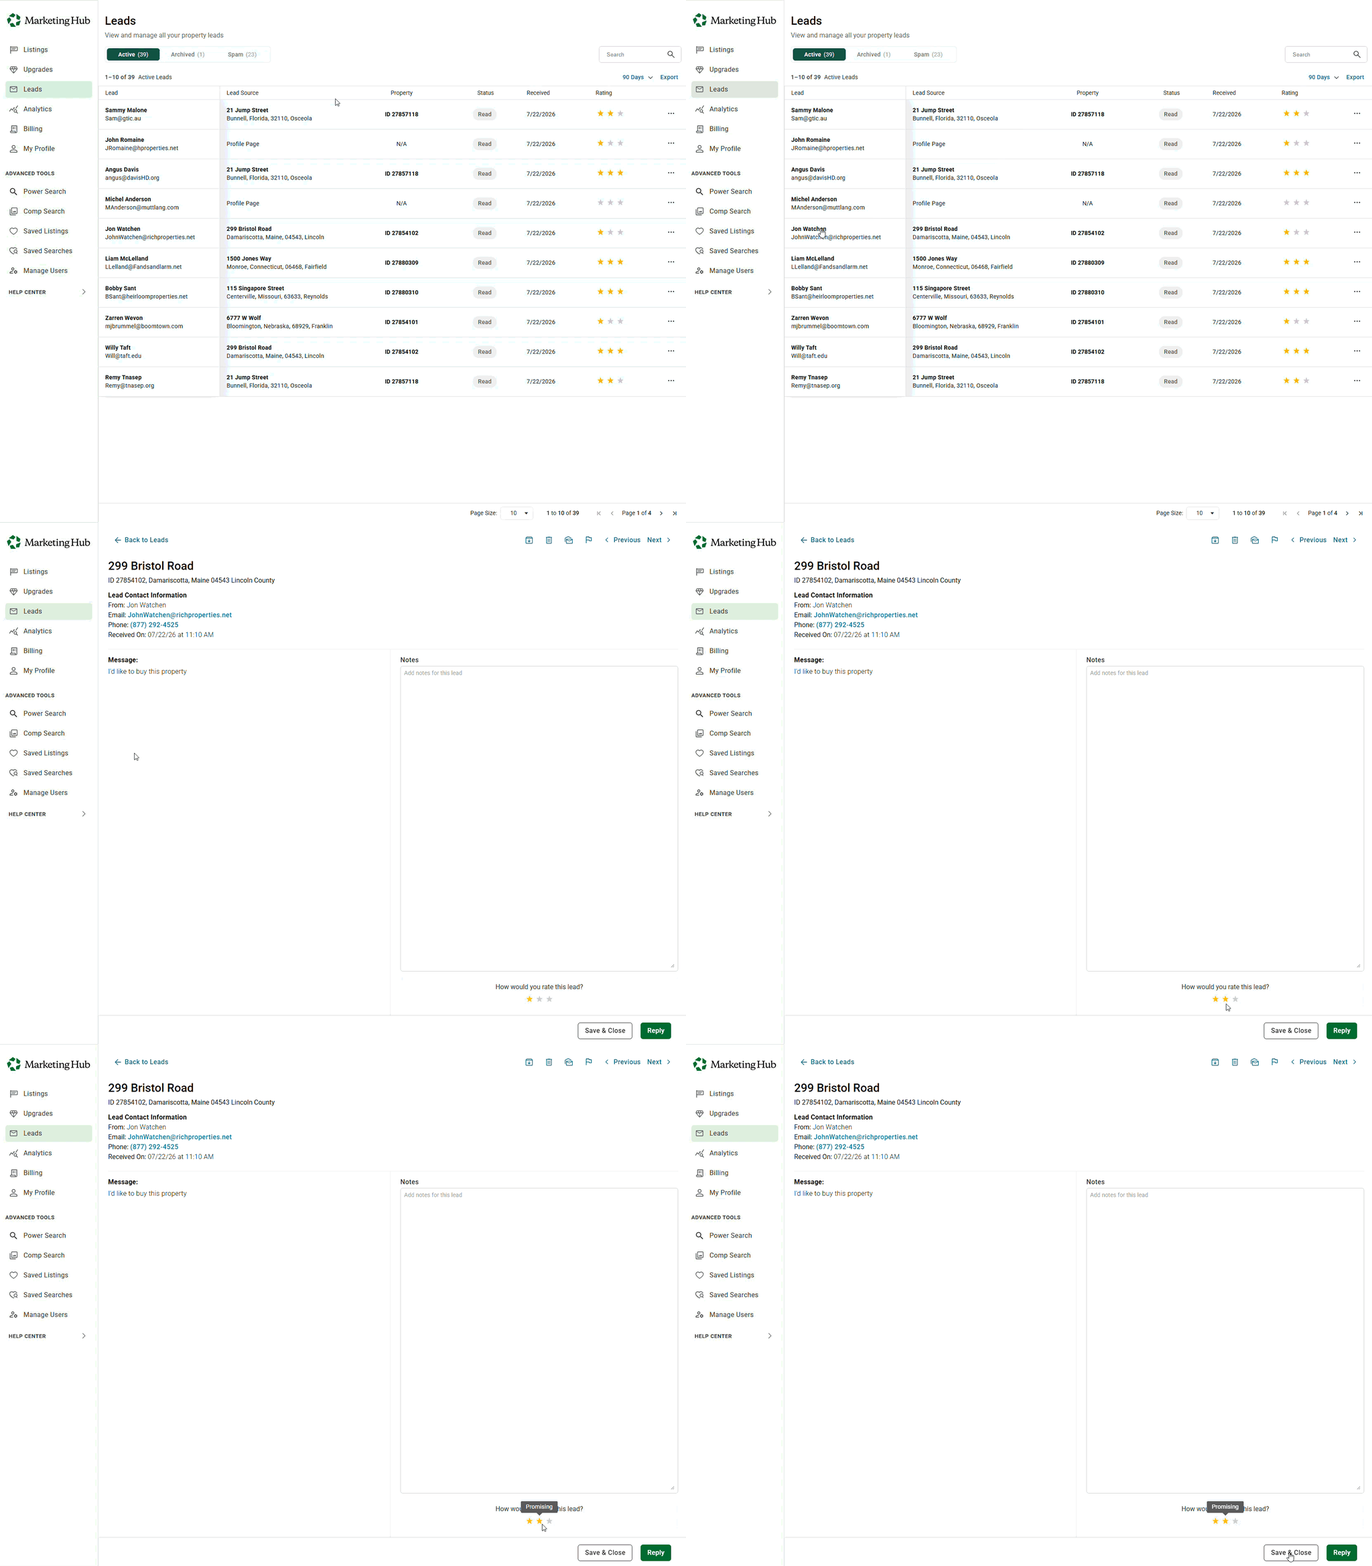
At a glance, the table shows:
- Lead: The name and email address of the person who submitted the lead.
- Lead Source: The title and address of the listing the person is inquiring about.
- Property: The listing ID number.
- Status: Whether the lead is New or has been Read.
- Received: The date the lead came in.
- Rating: A star rating you can assign to the lead.
Review Individual Leads
Click a lead in the table to open it. Inside, you will find:
- Lead Contact Information: the buyer’s name, email, phone number, and the date and time the lead was received
- Listen to recorded phone messages directly on the page
- Read email messages sent by buyers
- Add private notes about the lead for your own reference
- Assign a star rating to the lead
- Reply to the buyer, or use Previous and Next to move through your other leads
Wrapping Up
Analytics and leads work hand in hand. Analytics tell you which listings are earning attention, and leads turn that attention into conversations. Check both sections regularly to stay on top of your business and connect with buyers while their interest is fresh.